
How Deep Is the Water Under Your House in Nassau County?
Only where the water table sits close to your floor, and in much of Nassau County it does not. USGS wells read in spring 2016 found it 0.37 feet down at one harbor-edge well and more than 160 feet down on the hills, so the same damp floor can be groundwater in one place and a problem inside the house in another.
Already know you need someone out? Call (315) 640-3590.
What the federal depth map says about wet lower levels
Knowing roughly how far down the water sits tells you which fixes are worth pricing and which are aimed at nothing. The U.S. Geological Survey drew exactly that picture for Long Island in April and May 2016: a map of depth to the water table, with the shallow ground shaded red. In the map's own words, the red areas are where potential substructure flooding is more likely. The reverse is the useful part for most Nassau homeowners. Where the map shows the water tens of feet below the surface, there is no groundwater close enough to push up through a floor, and the damp has to be coming from somewhere else.
How far down it measured across the county
The map rests on real wells: USGS built it from 275 observation wells plus stream and lake gauges and the coastline, and it plots its own field readings, taken to the hundredth of a foot, on the sheet. Across the center of the county those spring 2016 readings ran roughly 19 to 48 feet down, including about 25 feet in Garden City and Levittown and 47 feet in Hicksville. On the ridge in the northwest they went past 140 feet in Lake Success, and a Syosset well read almost 165 feet. The shallow readings on the North Shore came from wells at the harbor and Sound edges, all standing 18 feet above sea level or lower.
Why two wells a mile apart can disagree by 165 feet
On Manhasset Neck, a Port Washington well read the water 0.37 feet below the ground in May 2016, while a Flower Hill well about 1.3 miles away read it 165.27 feet down that April. Both draw on the same upper sand and gravel layer. The difference is the land, not the water: USGS found that on the Neck the water table tends to parallel the land surface, so it rises under the hills but the hills rise faster. That is also why a headline about Nassau having the island's highest water table, which USGS does report for the northwest of the county when it is measured against sea level, says nothing about how far it sits below your floor. Height and depth are different numbers.
What the map cannot tell you about your own house
USGS is plain about the limits. The depth map is accurate at a scale of 1:125,000 with a vertical error of plus or minus 5 feet, because the land elevation data and the well data behind it were mapped at different scales. Along stretches of the south shore with no well data, including the marshes and the barrier island, the map simply assumed the water stood at sea level. And it is one season in one year. So we will not tell you the depth under a particular street or lot, and nobody should from this map alone. What it does is set the odds: shallow near low shoreline ground, deep under the hills and much of the middle of the county.
Is the water table rising under Nassau?
You may have read that rising groundwater is flooding basements nearby. That finding is real, but USGS made it for Kings and Queens Counties, after public supply pumping there was halted, and its report makes no such finding for Nassau. In Nassau the agency measured the opposite effect in the sewering era: in one 32 square mile sewered area, groundwater fell 11.8 feet against an unsewered area to the east between 1953 and 1972, and a later USGS model put the lowering from sewers at up to 18 feet in central Nassau. We are not aware of a USGS finding of a county-wide rise since, and we do not claim a trend either way.
What to do with the number
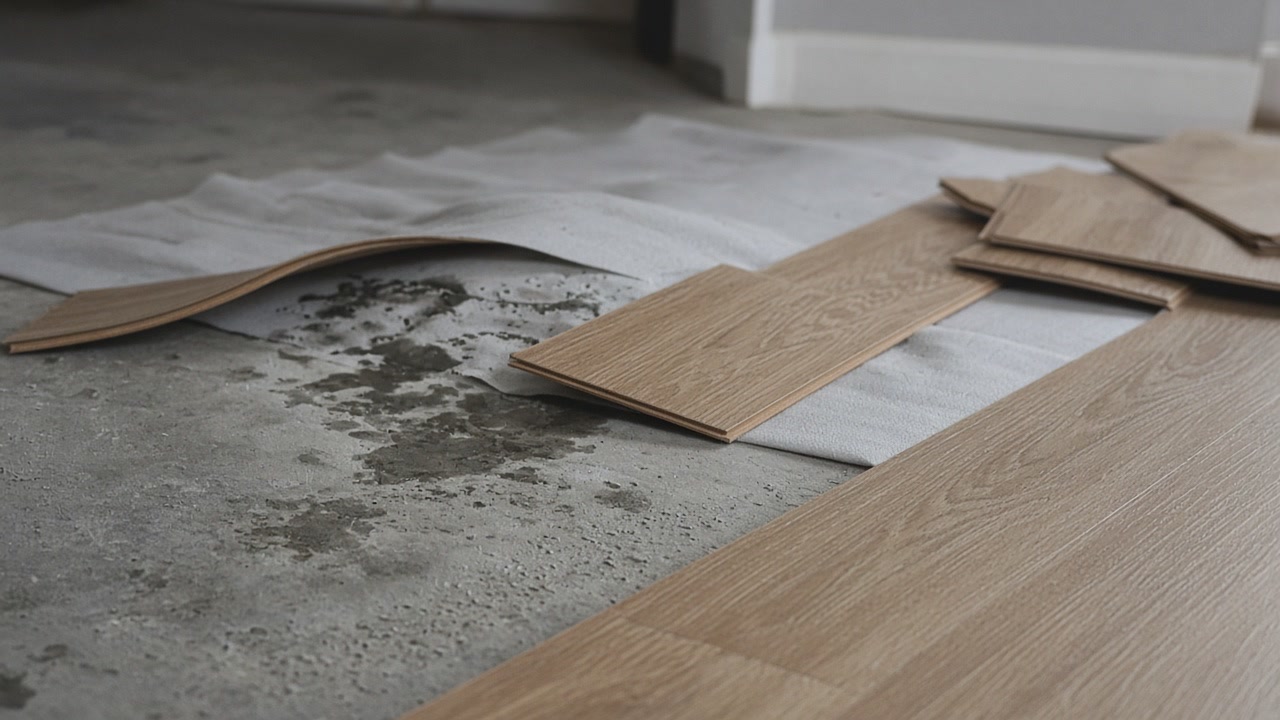
Use it to decide what to rule out first, not what to buy. If the house sits on low ground near the water and the damp shows at the lowest floor, groundwater belongs on the list and a sealer painted on from inside may be fighting a table a few feet down. If the house sits up the slope or in the middle of the county, a sump pump is aimed at water that is not there, and the search belongs in the house: the slab, the pipes, the gutters and grading, and condensation. A licensed assessor is the person whose job includes finding that source, and the practical direction test is in the next guide.
Sources used in this guide
The USGS map of depth to the water table beneath Long Island for April and May 2016 marks the shallow areas in red and states that those are the areas where potential substructure flooding is more likely.
Source: U.S. Geological Survey, Scientific Investigations Map 3398 (Como and others, 2018), accessed 2026-09-23
USGS plots its field measurements of depth to water, taken to a hundredth of a foot, on the 2016 depth map alongside the interpolated surface, which it built from 275 observation wells, 1 supply well, 13 stream gauges, 2 lake level gauges and the coastline.
Source: U.S. Geological Survey, Scientific Investigations Map 3398 (Como and others, 2018), accessed 2026-09-23
Individual USGS readings of depth to the water table in spring 2016 across the center of the county include 25.18 to 26.37 feet in Garden City, 24.39 to 26.36 feet in Levittown, 47.35 feet in Hicksville, 48.22 feet in Westbury, 35.80 to 36.10 feet in Elmont, 43.31 feet in Garden City Park and 19.57 feet in Farmingdale.
Source: U.S. Geological Survey, Water Data for the Nation, groundwater field measurements, accessed 2026-09-23
On the moraine ridge in the northwest of the county, USGS water table wells read 141.40 to 141.82 feet down in Lake Success and 122.79 feet down in University Gardens in spring 2016, and a well inside Syosset at 227 feet above sea level read 164.83 to 164.88 feet down.
Source: U.S. Geological Survey, Water Data for the Nation, groundwater field measurements, accessed 2026-09-23
In the spring 2016 USGS readings from North Shore Nassau water table wells, every well with water less than 10 feet below the surface stood at a land elevation of 18 feet or lower, at the harbor and Sound edges, including readings of 6.12 and 7.80 feet in Kings Point, 7.34 feet in Sands Point and 7.77 feet in Baxter Estates. Wells farther up the slopes read tens of feet.
Source: U.S. Geological Survey, Water Data for the Nation, groundwater field measurements, accessed 2026-09-23
Two USGS water table wells on Manhasset Neck, roughly 1.3 miles apart and both screened in the upper glacial aquifer, gave spring 2016 readings of 0.37 feet below land surface at well N 9608 in Port Washington on May 23 and 165.27 feet below land surface at well N 4223 in Flower Hill on April 19.
Source: U.S. Geological Survey, Water Data for the Nation, groundwater field measurements, accessed 2026-09-23
USGS found that September 1996 water table levels on Manhasset Neck ranged from 3 to 120 feet above sea level, with the highest in the central and southern parts of the peninsula, and concluded that in general the water table there tends to parallel the land surface.
Source: U.S. Geological Survey, Water-Resources Investigations Report 00-4193 (Stumm, Lange and Candela, 2002), accessed 2026-09-23
For its April and May 2016 survey USGS collected 76 water table measurements in Nassau County, with the water surface ranging from 1.64 to 120.93 feet above the 1929 sea level datum, and it reports the island's highest water table, more than 120 feet above that datum, in northwestern Nassau County.
Source: U.S. Geological Survey, Scientific Investigations Map 3398 (Como and others, 2018), accessed 2026-09-23
USGS states that its 2016 depth to water table map is accurate only at a scale of 1:125,000 with a vertical error of plus or minus 5 feet, because the land elevation data and the water table data behind it were mapped at different scales, and that the general pattern of depth to water follows the topography.
Source: U.S. Geological Survey, Scientific Investigations Map 3398 (Como and others, 2018), accessed 2026-09-23
Where USGS had no water level data along the south shore of Long Island, including the marshes and the barrier island, its 2016 depth map assumed the water table stood at sea level.
Source: U.S. Geological Survey, Scientific Investigations Map 3398 (Como and others, 2018), accessed 2026-09-23
A USGS study of Nassau County found that ground water levels in a 32 square mile sewered area fell 11.8 feet relative to an unsewered area to the east between 1953 and 1972, attributing 4.9 feet of the decline to pumping in Queens and most of the remaining 6.9 feet to sewering.
Source: U.S. Geological Survey, Garber and Sulam (1976), accessed 2026-09-23
A USGS computer model of Long Island's groundwater system estimated that sanitary sewers would lower the water table by as much as 18 feet in central Nassau County and about 9 feet in Suffolk County.
Source: U.S. Geological Survey, Reilly, Buxton, Franke and Wait (1983), accessed 2026-09-23
The USGS finding that recovering water levels flooded underground structures comes from its history of groundwater use in Kings and Queens Counties, where public supply pumping was halted, and its abstract makes no such finding for Nassau County.
Source: U.S. Geological Survey, Cartwright (2002), accessed 2026-09-23
Services this guide relates to
Need someone to look at it?
Send the details and we will come back to you.